Get the best of reports in Recommend

To be able to track the results of your actions is key to the success of your business. Reports are one of your best assets, and you should be using them to their full potential. However, several studies are showing that up to 55% of marketers don’t feel they have the necessary data from reports. Another 74% don’t know how to use reports and how to track their actions.
The possibility of measuring the impact that specific activities have on your eCommerce strategy is essential to understand, not only your business but also your consumers. Most companies that achieved success in e-Commerce use reporting to enhance their performance. In the path of personalisation, adjusting your overall strategy, when need it, is the secret to have good results.
Reports
The report section is in the main menu on the left of your screen (after ‘Messaging’). When you click on it, you will see a list with all the options available within this function:
- eCommerce: An overview and also performance by panel, sales, product and category.
- Audience: Page Views and Visits.
- Catalogue: Your products.
- Marketing Notifications: Performance, Abandoned Carts, Activity
eCommerce
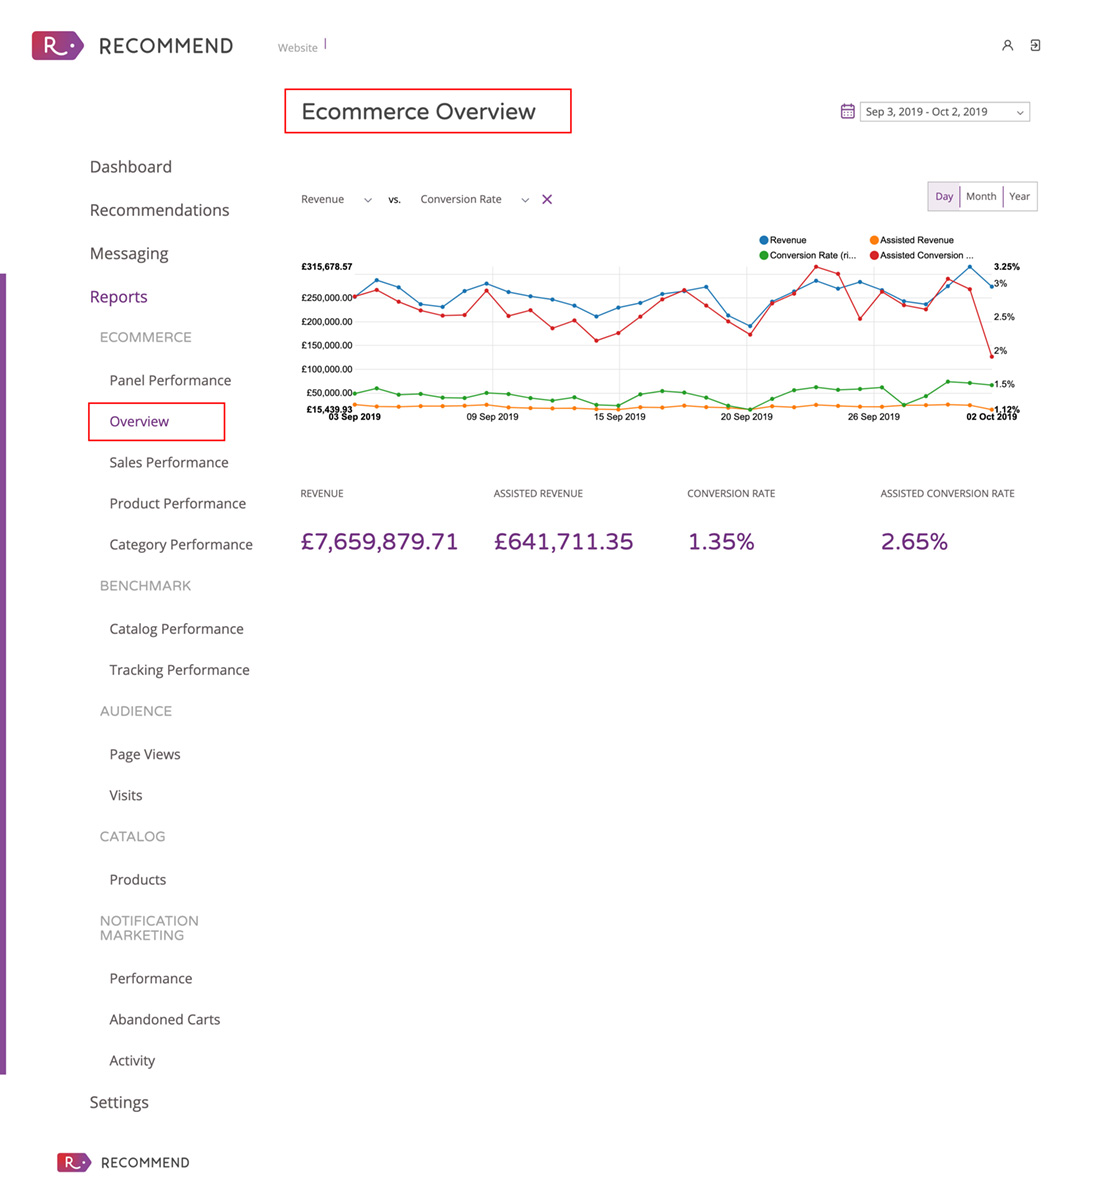
The eCommerce Overview shows your general performance comparing your revenue versus your conversion rate. The “Assisted revenue” and “Assisted conversion rate” are metrics related to the results provided by the use of our platform. For example, “Assisted revenue” means revenue brought from purchasing a product suggested on one of our panels.
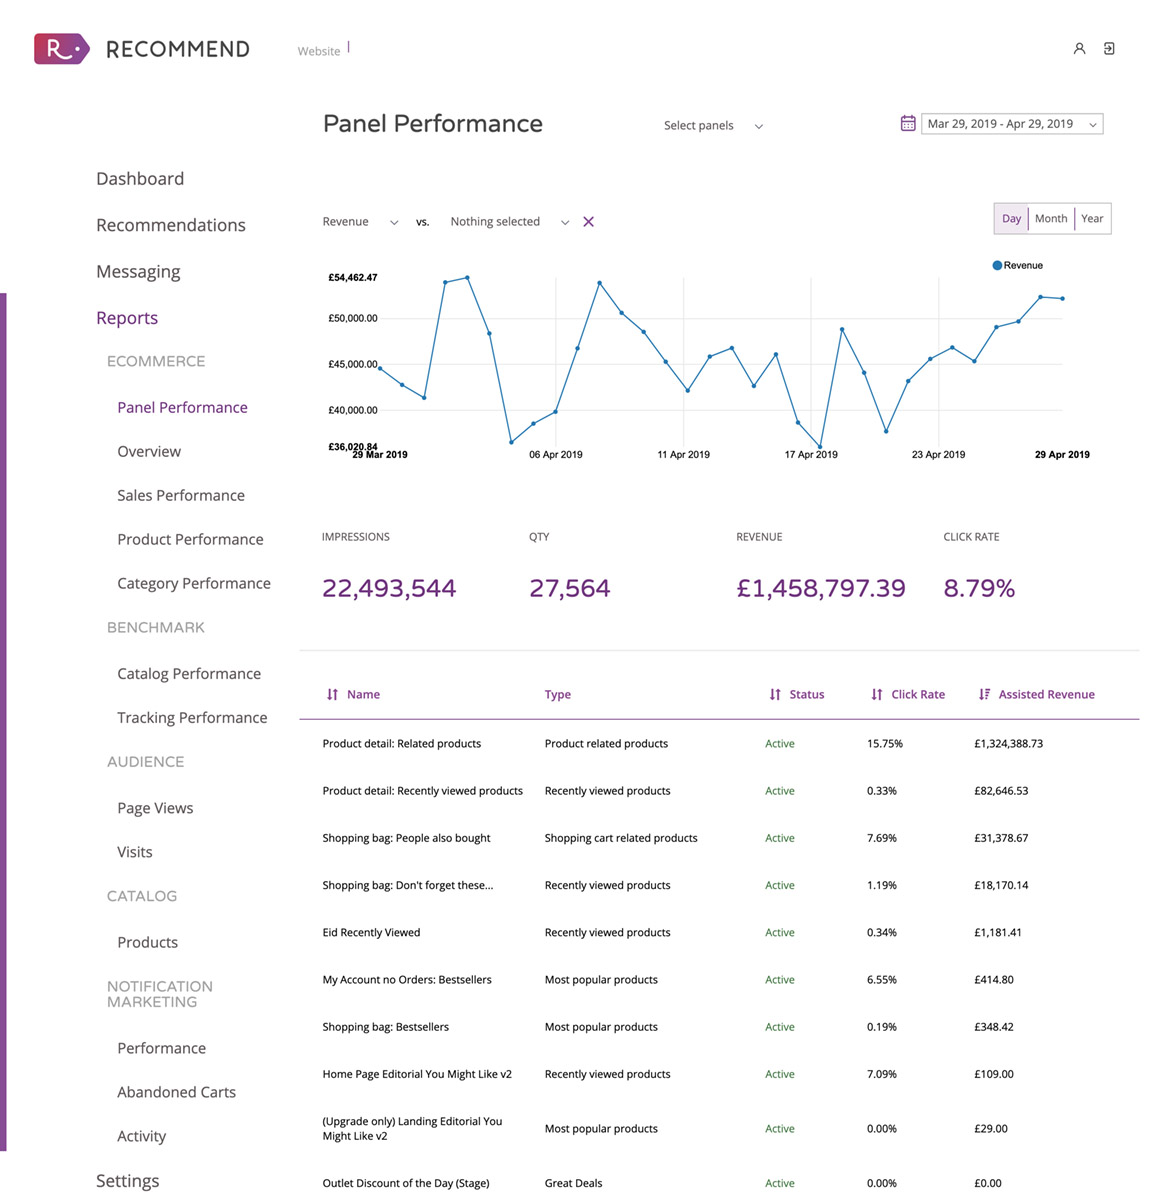
Panel Performance: This section shows you the performance of your panels comparing revenue versus click rate, impressions and quantity (QTY). It also includes the total for each metric. At the bottom, you can see more detailed information about each of your panels, including name, type, status, click rate and assisted revenue.
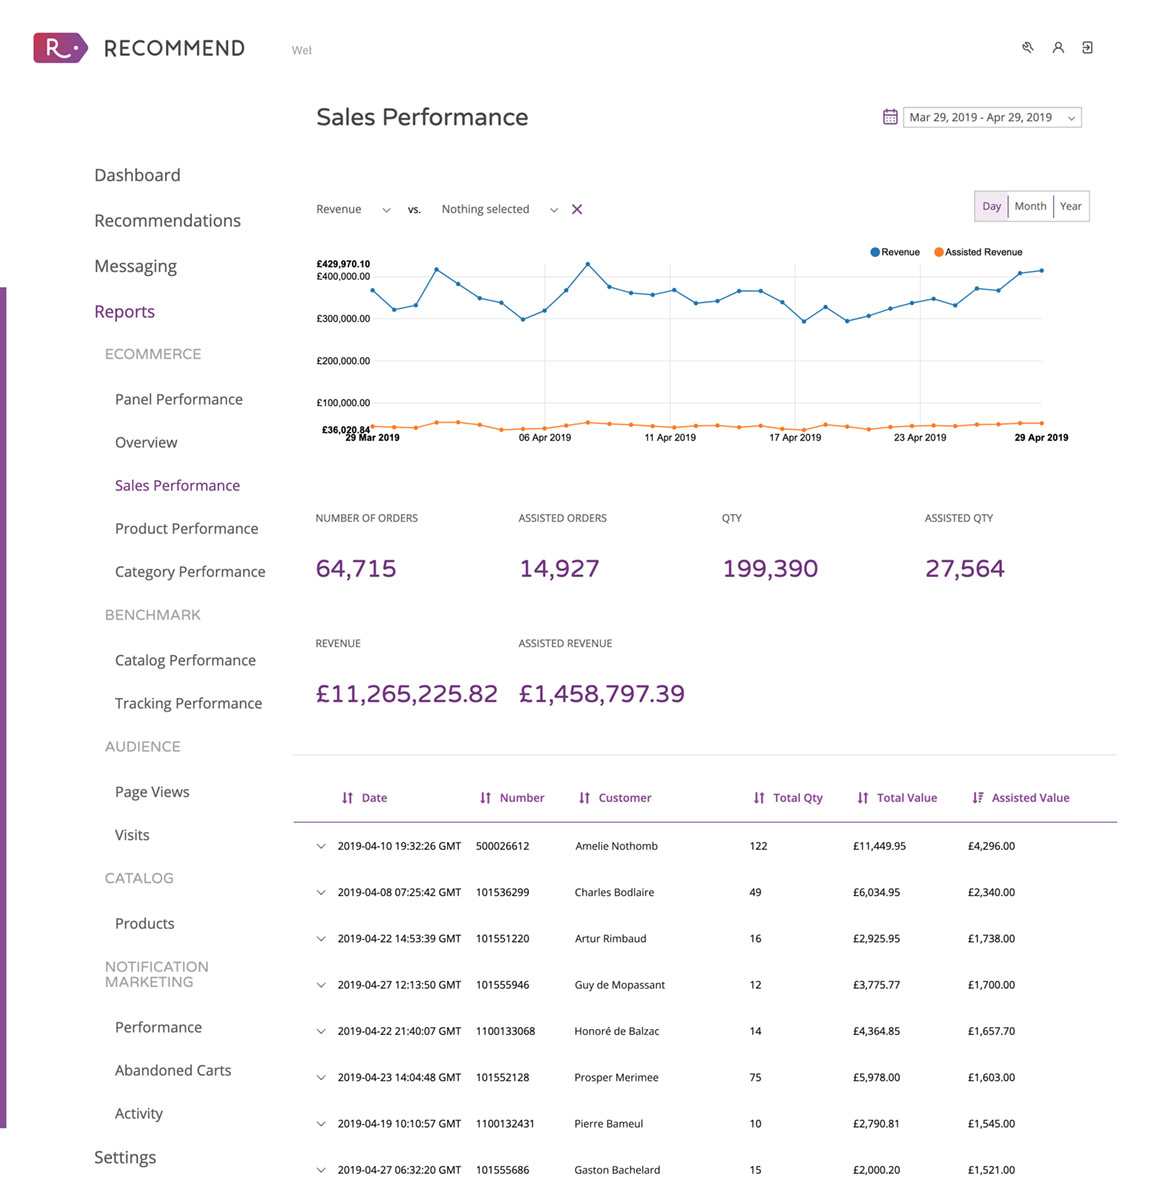
Sales Performance: Here, you can track your daily, monthly or yearly sales. It provides you with a comparison between revenue versus the number of orders and quantity (QTY). At the bottom, you can see more detailed information about purchase date, the number of the order, the name of the customer, quantity, total value and assisted value.
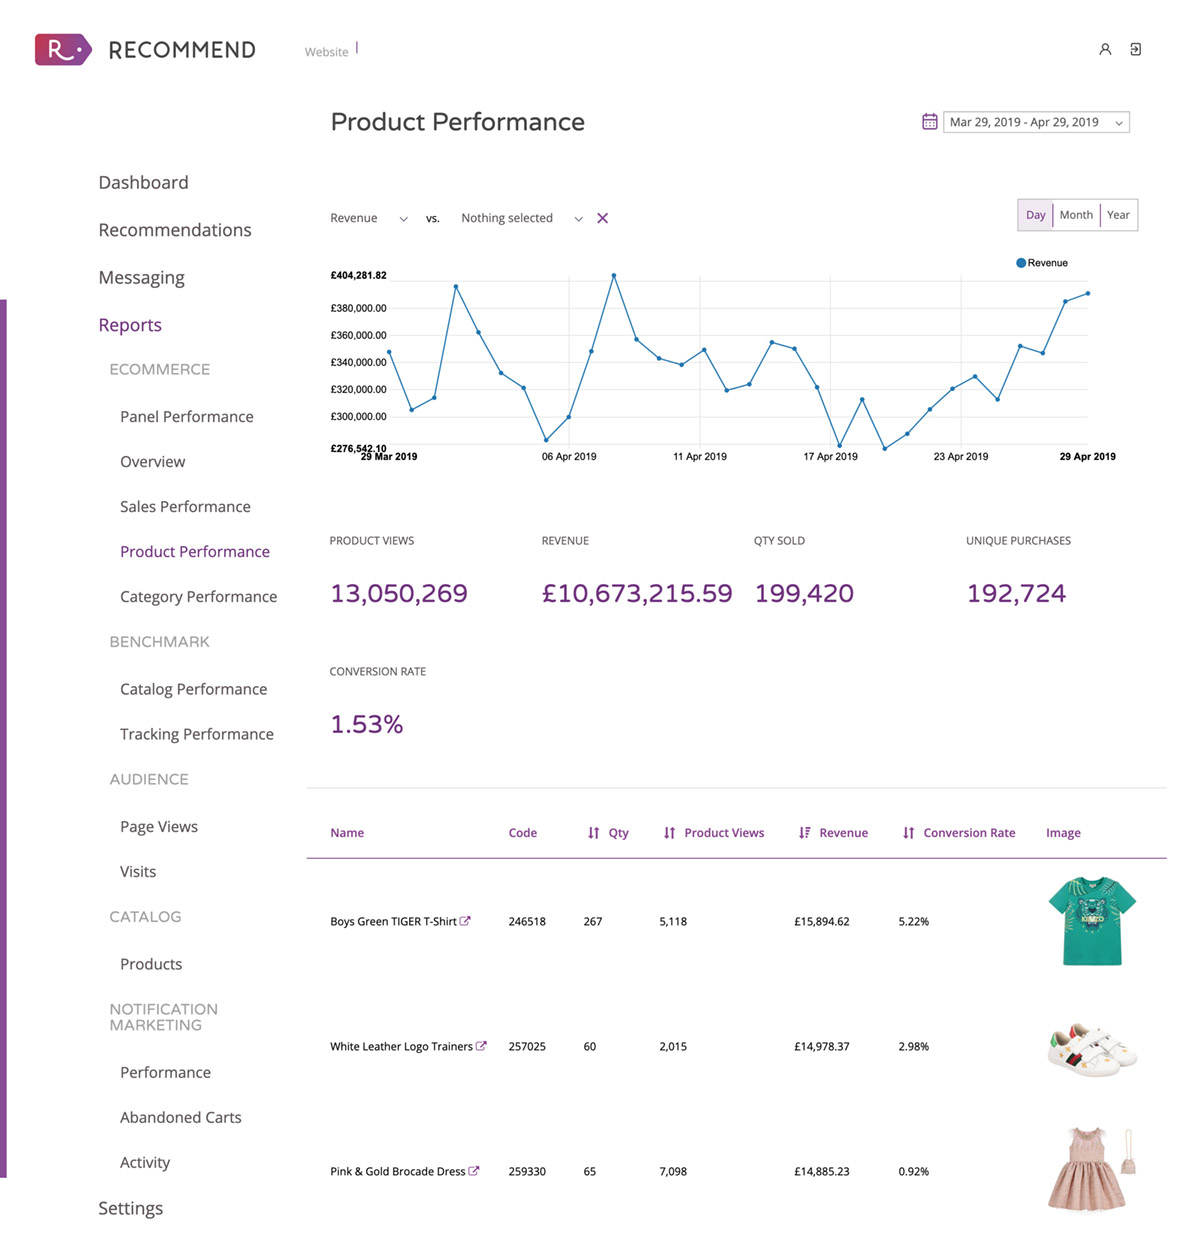
Product Performance: Identify your products’ performance by tracking revenue, quantity sold, unique purchases, products views and conversion rate. It also shows other information such as product name, code, quantity (QTY) and a picture of the item.
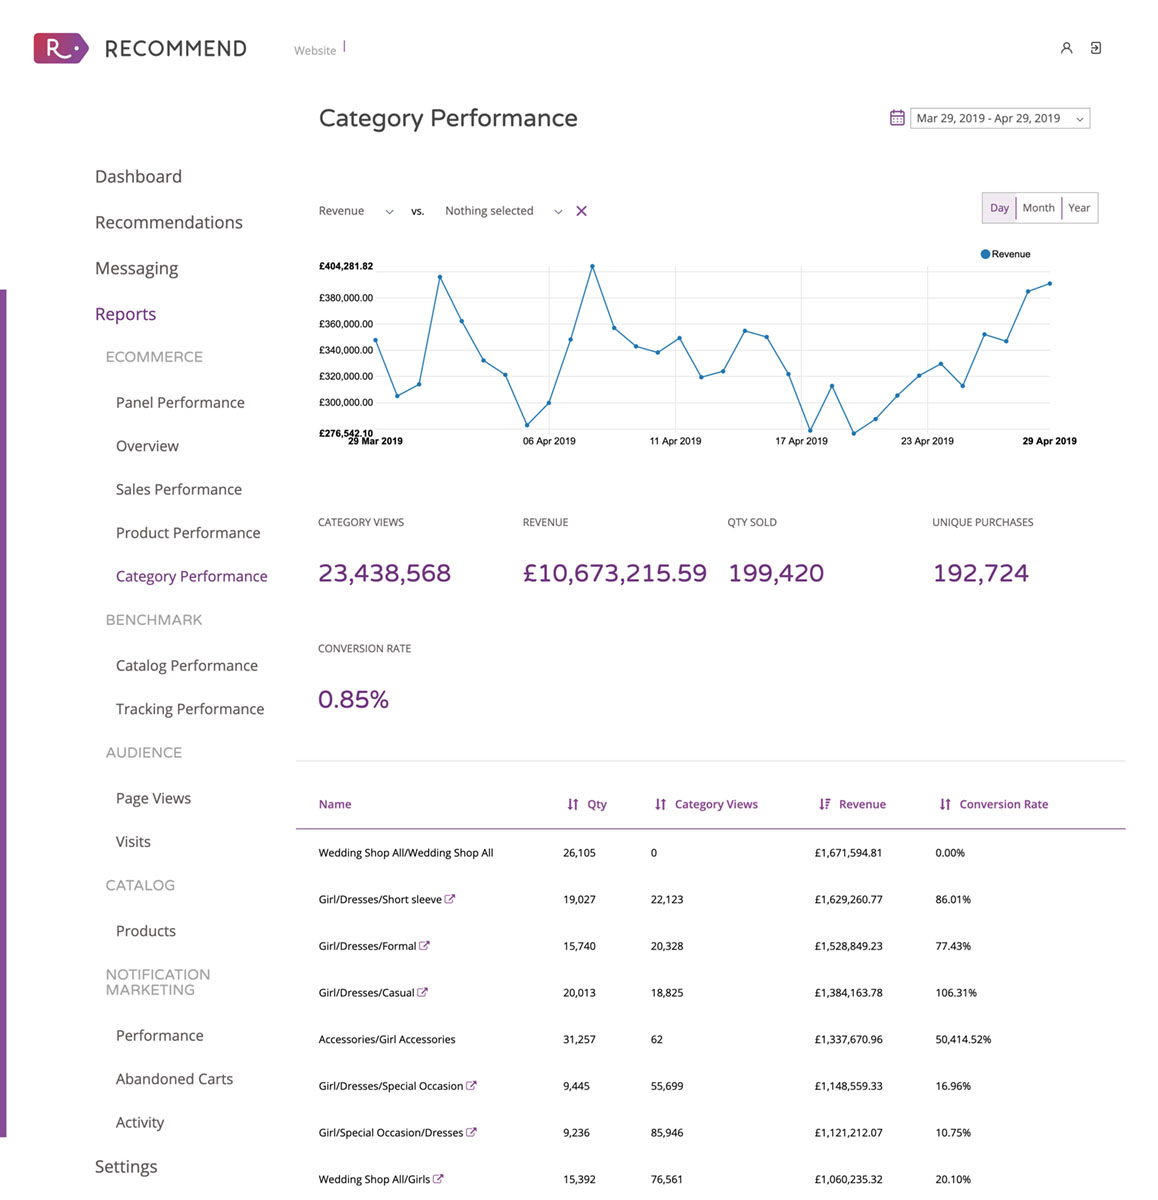
Category Performance: Track the performance of your category pages in terms of revenue, quantity sold, unique purchases, category views and conversion rate, including totals for each metric. At the bottom, you will see the information displayed based on the category name, QTY, views, revenue and conversion.
Audience
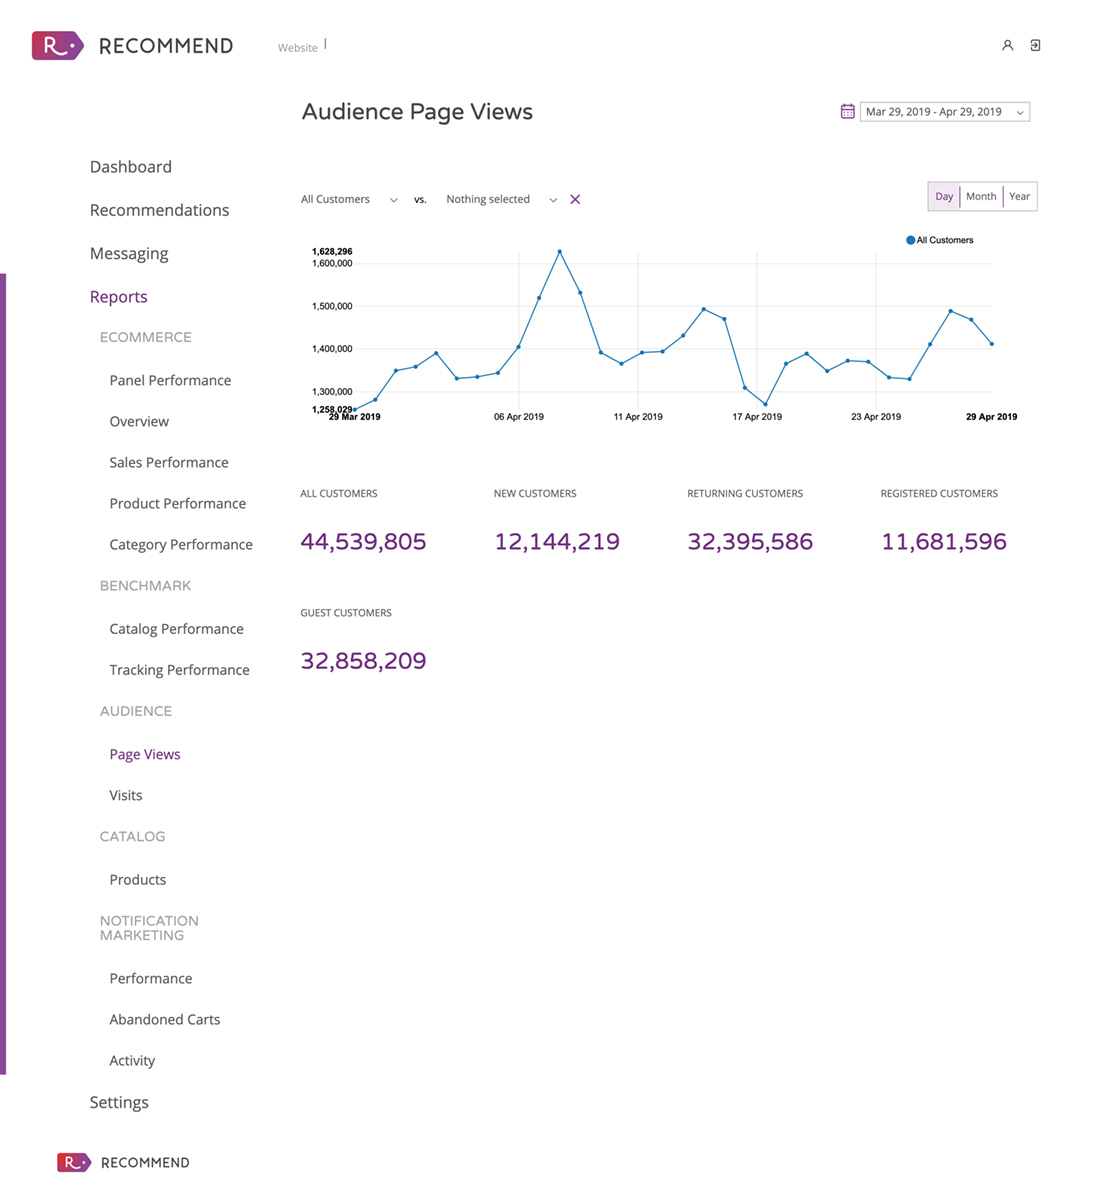
This section lets you track page views and visits. Both show the same metrics –all customers (new, returning, registered, and guest customers)– but track different behaviours. Page Views track visits on particular pages while Visits track individual visits. For example, if a customer comes to a website and visits 25 pages in one session, it will be tracked as one visit and 25 page views.
Catalog > Products
Here you can track your product performance and existence. It shows you all your catalogue including names, codes, prices, views, quantity sold, revenue and the status (in stock or out of stock). Recommend takes the data from the website directly, and products status are updated regularly.
Notification Marketing
This section has been created to track the performance of your marketing communications and how your smart campaigns are doing from transactional emails to push notifications.
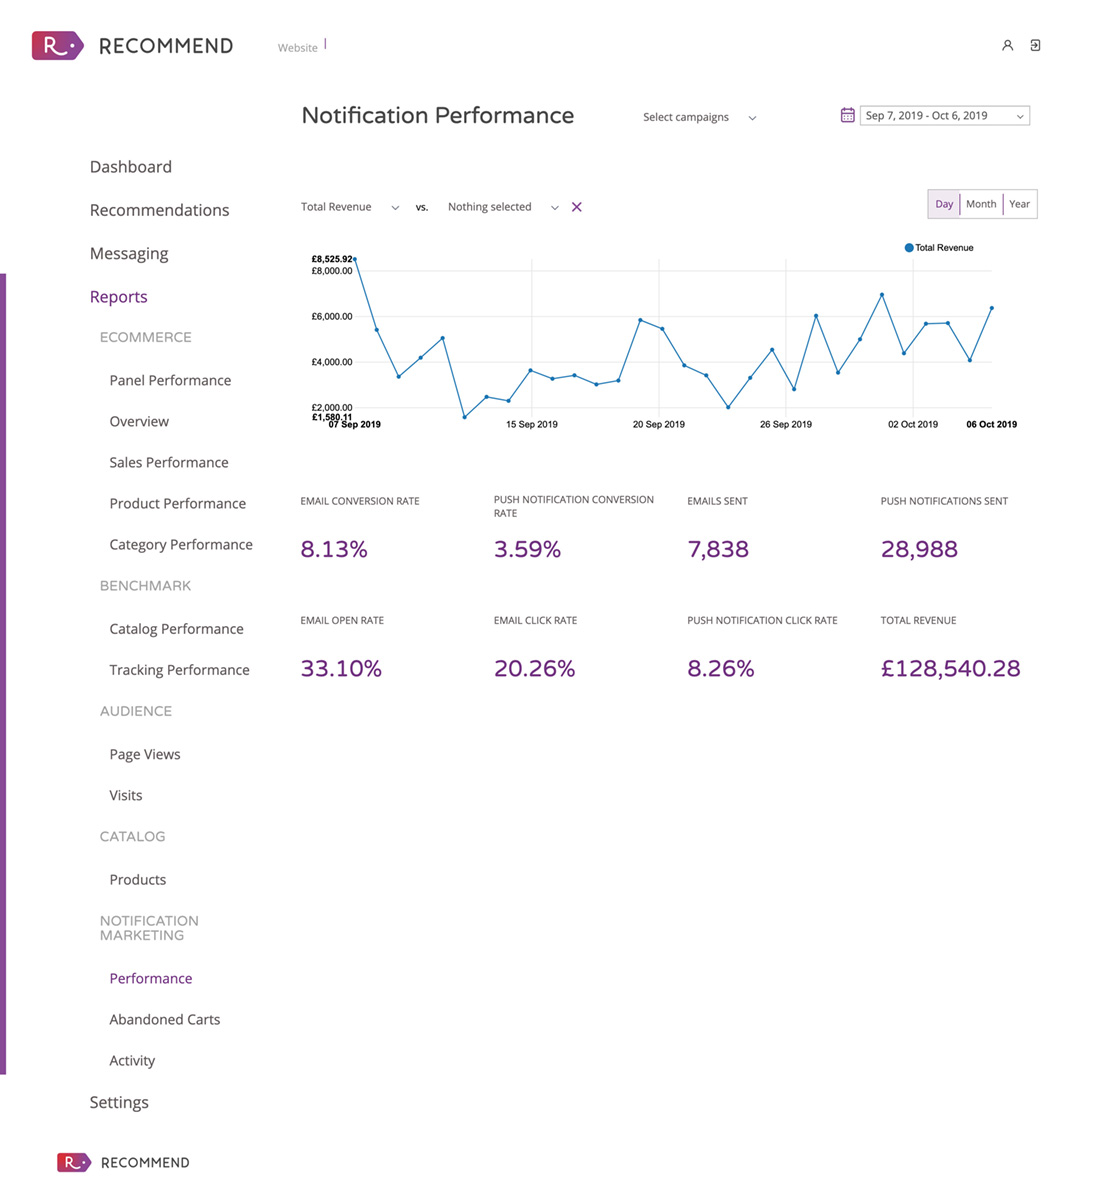
shows a general overview of your campaigns including total revenue, open rate, click rate and the number of emails and push notifications sent over time (day/month/year)
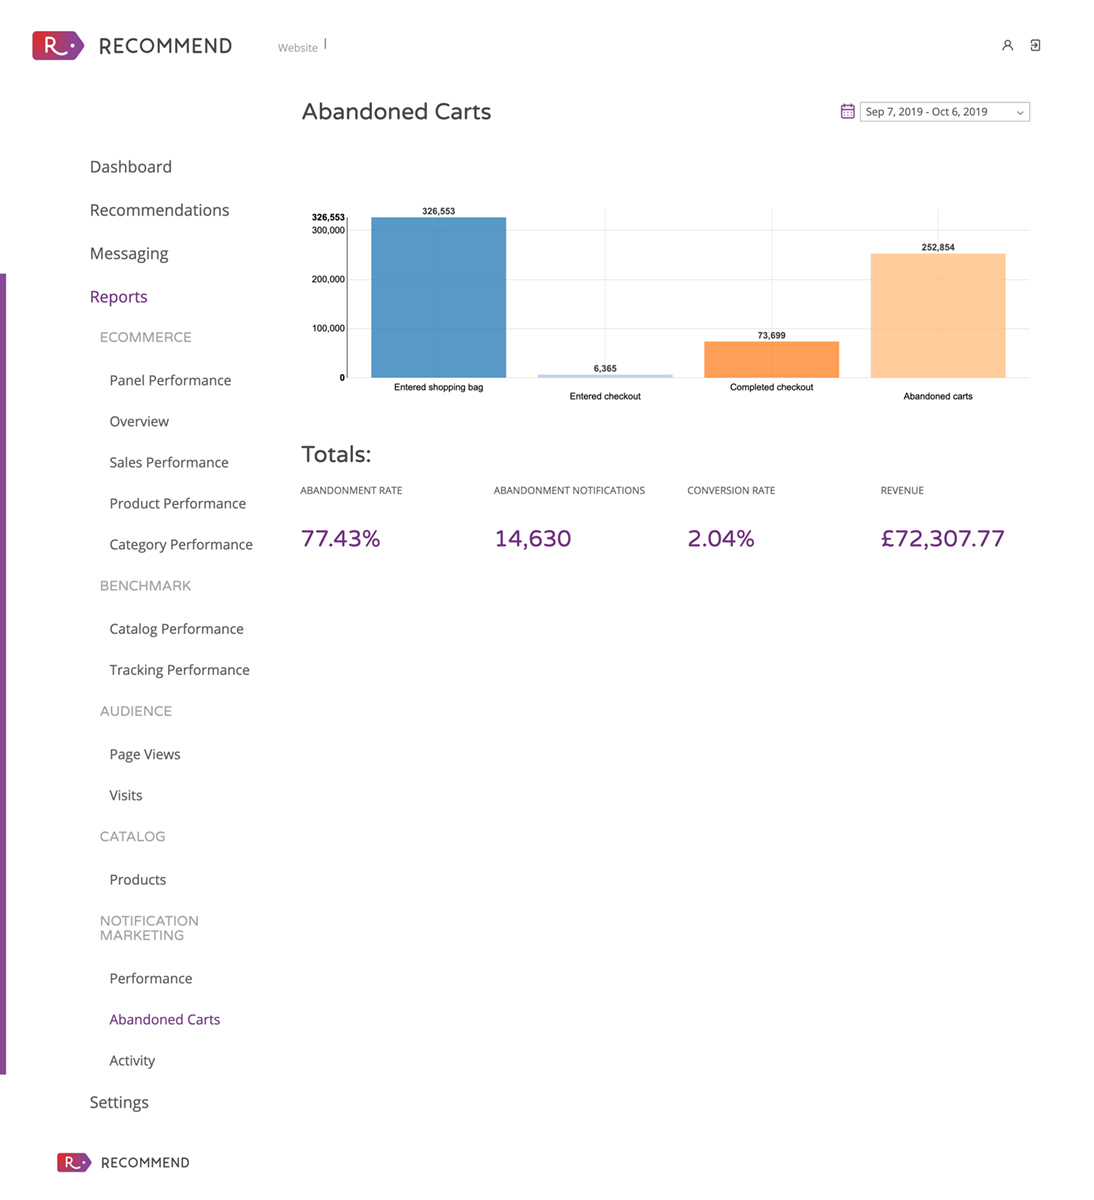
Abandoned Cart is an essential function for your eCommerce business. The graphic shows the different stages of the purchase journey. From when customers add items to the shopping cart, the number of clients who enter the checkout process; how many complete the checkout and how many abandon the shopping cart.
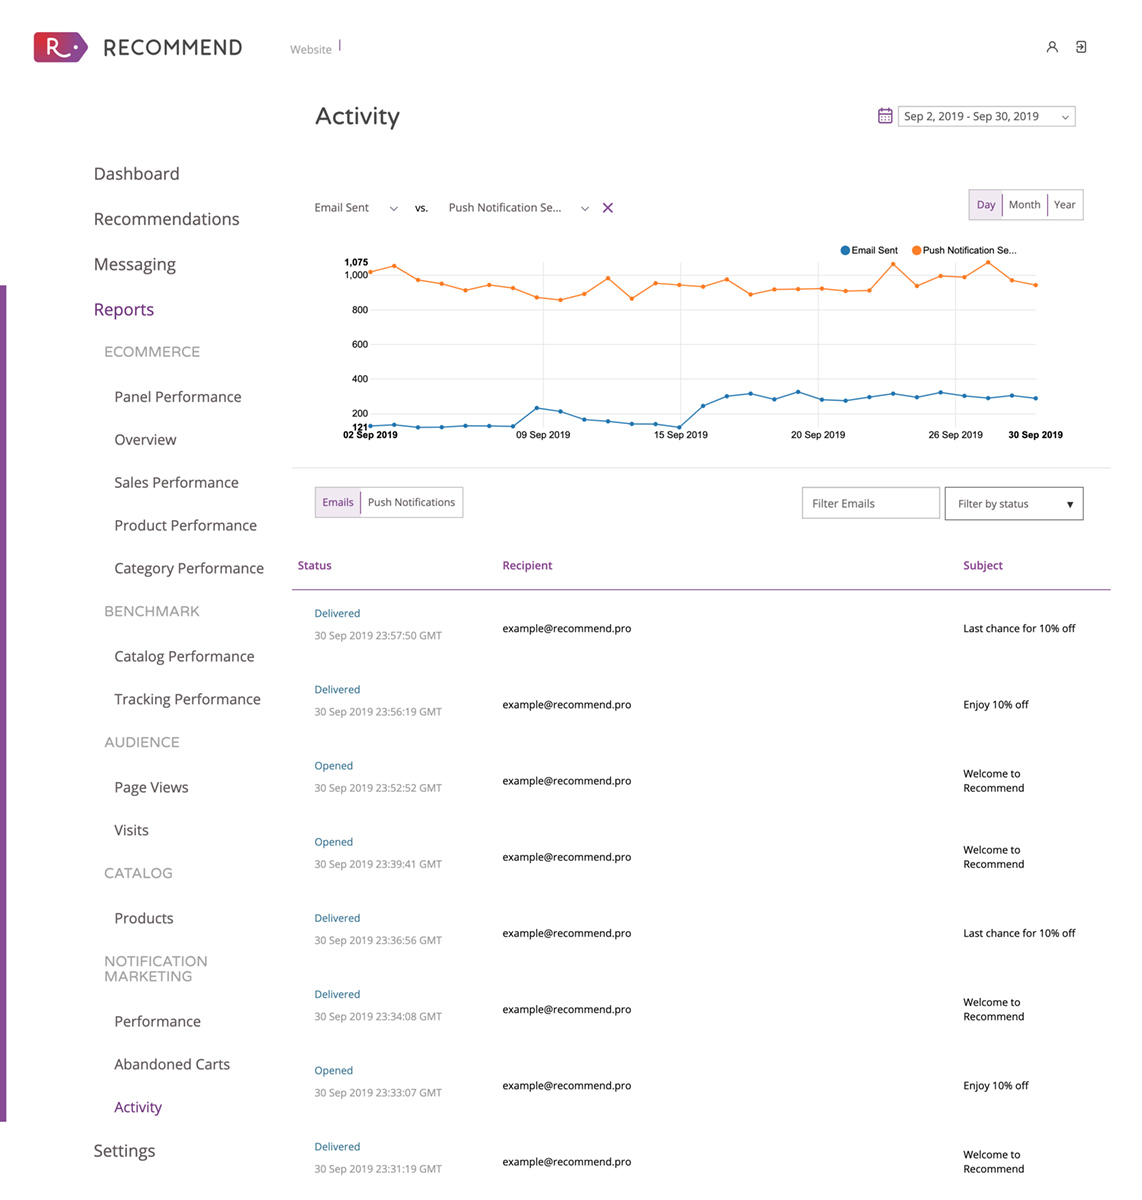
Activity helps you track the performance of your communications. From the number of emails sent and delivered to opens, clicks, failed and complained. This section also shows you the status of your emails (delivered, failed, opened), the recipients’ address and the subject of the email. To check the status of your push notifications, check the tab in the ‘Activity Report’.
- The term “complained” is used to identify when a user reports the email (from “mark as spam”, complained to their email provider, to notified Amazon SES directly.)Here you can find more information about this status.
Reports customised
Our real-time statistics and report section are so reliable and effective than some of our clients are using Recommend, not only as a personalisation platform but also as their analytics and data provider.
With Recommend you can have all the information you need within our platform. Besides, we have created some special filters to give our clients the specific insights they need to understand and analyse the performance of their businesses.
If you want to know more and start enjoying the benefits of personalisation for your eCommerce, register in our free trial here.


