Real-time statistics at your fingertips

Insights and statistics are vital to understand your business and analyse trends. Although, did you know that 74% of marketers can’t measure or report how their efforts impact their business? And that only 22% of Marketing Teams have successful, data-driven initiatives? These data come from reports by Forbes and ITSMA and Vision Edge Marketing.
To have access to data doesn’t guarantee the effectiveness of your strategy. However, real-time statistics and live insights into the behaviour of your visitors can be beneficial. Certainly, when it comes to your actions.
Above all, an analytical tool gives you the ability to collect, calculate and understand insights and data. As a result, this information can be used to determine what’s working, what can be improved and the return on your actions. In this article, we will explain how your dashboard functions as a real-time statistics tool:
Dashboard
Right after logging in, you have access to your dashboard. Here you will see real-time statistics of the activity that has been registered on your website at that moment. Your dashboard is organised by “Number of Active Customers”, “Live Overview” and “Latest Website Events.”

Number of active customers
This area shows the number of active visitors on your website. The pie charts represent the activity of these users in percentages, based on:
- Activity: Browsing, Thinking, Buying
- Condition: New or Returning visitor
- Status: Registered or Guest
- Device: Desktop, Tablet or Mobile
- Country
- Traffic: Direct of Referral

Live Overview
Here is where real-time statistics take place. Firstly, circles represent your website’s visitors. Secondly, the colours let you identify their status and behaviour. As people leave, the circles fade and over time get replaced by new visitors.
Customer Details
Each circle has different elements within. Those symbols represent the status and behaviour of each of your website visitors:
 | Dark purple means a new visitor |
 | Light purple means returning visitor |
 | The check (✓) means the customer is registered |
 | The bag represents the shopping cart, and the number indicates how many products |
To display more detailed information about the customer, click on the circle. Here you can see:
- Customer’s name if they are registered
- Location and IP address
- The start time of the current session and how many sessions they had before
- Device (desktop/mobile/tablet)
- Products added to the shopping cart
- View history shows their actions during the current visit

Latest website events
Likewise, here you can visualise your real-time statistics. But, instead of pie charts and icons, the information is descriptive. To sum up, here you can find all your website events organised by customers, products and sales. For instance, the sales column displayed all the information related to a purchase: order, the name of the customer, the amount spent and number of products.
 | 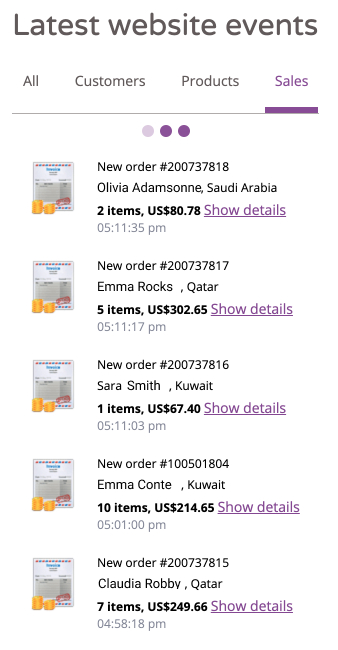 |


