5 KPIs for a successful e-Commerce business

Key performance indicators, or more commonly known as KPIs, are frequently used by companies to measure key business objectives. They are also used to evaluate the success of the goals achieved after implementing a strategy. Before jumping into our list of top 5 key performance indicators, we need to understand why KPIs are so important and why you should be paying more attention to them:
Why are KPIs important?
According to Reflektive, approximately 90% of companies don’t achieve their goals. This is quite a large percentage, and it further underlines the need for understanding why key performance indicators are so relevant. Avinash Kaushik, digital marketing evangelist at Google once said “most businesses are data-rich, but information poor” – this quote highlights the issue. Brands aren’t able to utilise all the data they have access to, and further analyse it using KPIs to achieve their goals.
Without KPIs, it isn’t very easy for any company to gauge progress over time. Without them, marketers would have to make decisions based on just their gut instinct or best practices. With KPIs, you can make informed decisions that will benefit your long-term strategic plan. It will help you set realistic and achievable goals for your business. Another aspect to remember is that the real value lies within the actions taken from analysing the data. Marketers and data analysts need to make sure all team members are on the same page regarding company objectives and KPIs to come together for critical problem-solving.
Effective KPIs: Types and Characteristics
There are many different types of key performance indicators, however, when it comes to measuring the effectiveness of your strategic e-commerce plan, KPIs usually fall into one of the following five categories, according to Shopify.
- Sales
- Marketing
- Customer Service
- Manufacturing
- Project Management
There are also more than 70 different types of KPIs brands can use to extract various information from data. However, it is essential to understand what characteristics to look out to understand which KPIs will draw out the best results. There are five major characteristics brands need to be aware of to choose the most suitable and effective KPIs.
Simple
For a KPI to be truly effective, it needs to be simple in two significant ways. It needs to be easily understandable and measurable. A key performance indicator should enable brands to make decisions easier rather than question the issue further.
Relevant
When analysing a KPI, the responsible manager needs to be able to assign it to the right team member. It’s important to make sure the measurement will be better understood, more educated and the results will be successful.
Aligned with the overall strategy
When choosing the most appropriate KPIs brand managers to need to ensure that the overall objective aligns with the overall strategy of the company. For example, an online fashion retailer would probably be more concerned with their check-out conversion rates rather than social media followers.
Measurable
When considering the measurability characteristic of a KPI, there are two factors to consider whether you are looking for qualitative or quantitative results. In some cases, companies will be looking for both. When it comes to qualitative measurements, marketers need to ensure that the KPI is focused on a solid goal like sales or marketing, rather than generalised questions.
Timely
Last but not least, brands must analyse KPIs using a relevant timeline, to avoid infrequent reporting that may lead to difficulty in identifying trends, issues or diminishing of collected data.
5 KPIs for eCommerce Brands
Here is a concise list of 5 key performance indicators for e-commerce businesses. These KPIs will be able to help your business expand in many areas like sales, acquisition and conversion rates, along with the possibility of identifying potential opportunities and drawbacks.
Cart Abandonment
Cart abandonment is one of the most significant issues faced by online retailers and eCommerce. 55% of customers add items into the shopping cart but do not check out. The reasons are various: the high cost of shipping (58%), free shipping not available (50%), or the preferred payment option wasn’t included (25%).
As easy as it seems, eCommerce brands spend a lot of time and money encouraging customers to complete their purchase and to click the check out button. However, still, cart abandonment rates are higher than the average. So, how can companies fix this issue?
Tracking cart abandonment rates can tell you the percentage of customers that will abandon their carts before completing a purchase. You can track it depending on the day, month or season. This KPI is beneficial if any brand wants to forecast the issue. Once companies can address their good and bad periods, marketers should prepare a robust retargeting campaign to encourage customers to check out.
Conversion Rate
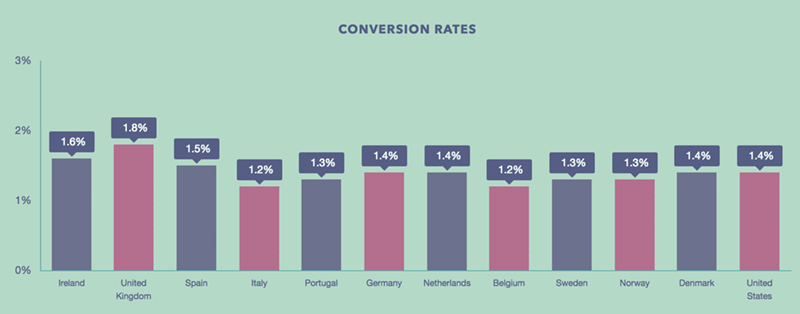
The conversion rate is one of the most important and can reveal interesting insights about your business. Conversion rate can tell you a lot about your websites’ call-to-action and the effectiveness of your landing pages. Before doing the math and calculating your websites’ conversion rate, you also need to base your result on industry benchmarks. According to Oberlo, the average conversion rate for online shoppers worldwide should fall somewhere between 1.89% and 3.3%.
“The average conversion rate for UK retailers in 2019 was 1.8%, one of the highest in Europe.”


Average Order Value
The average order value is also known as the AOV. The AOV shows the average amount of money that your customers spend per order in any given time. The AOV is very easy to calculate compared to the other KPIs. All you need for this is your average order value and your total revenue figure for that same time frame. According to OnTrack Digital, the average AOV rate for e-commerce brands globally is around $107. A brands’ AOV rate also directly impacts customer acquisition costs. For example, by receiving more money from each customer, companies can absorb a higher CAC’s while still maintaining profits.
Customer Acquisition Costs
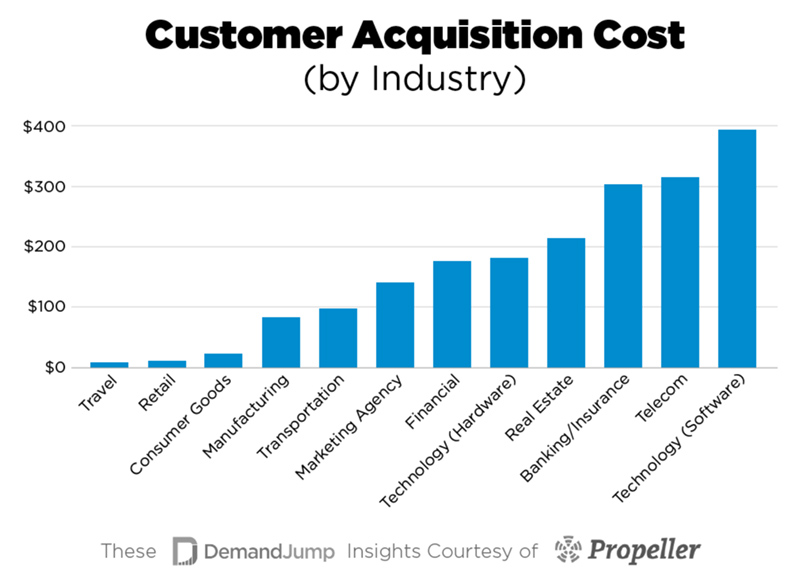
The customer acquisition cost, or more commonly known as the CAC, can make or break your business. The CAC is all about analysing how much it costs your brand to win over a user and convert them into a customer. According to Demand Jump, the average customer acquisition cost in 2019 for retail was $10. Every company must know their CAC rate to plan its marketing budget. CAC is about to see the number of customers they want and can afford to acquire during a specific time.

Customer Lifetime Value
Last but not least, the CLV answers one fundamental question, how much is a customer worth to your business? The CLV is the average amount of net profit that each customer contribute to a business over the entire length of the relationship. The CLV enables companies to understand your return on investment (ROI). And this directly has an impact on whether a companies goals and objectives are achievable and realistic. A 5% increase in customer retention can increase company profits by 25-95%, and repeat customers can spend up to 67% more than new customers.


