Product update: Reporting

The eCommerce industry is ready for an exciting future. The latest studies estimate that eCommerce retail sales will account for 17.5% of overall retail sales worldwide. So, the need for good reporting is more important than ever!
With the constant transformation of the retail industry, online shoppers are also looking for an improved shopping experience and brand engagement. In this competitive environment, eCommerce stores must make data-driven decisions not only to keep up with what works but to be able to predict behaviour and trends.
Data-driven marketing is a strategy for collecting customer data and then making predictions. It’s about understanding customer data, organizing it, analyzing it, and using it for future marketing efforts. Among the advantages of making data-driven decisions are:
- Conversion tracking: rate, revenue, order value, most popular products
- Analyse your visitors’ referral sources to identify high-performance channels: newsletter, organic or paid traffic, social media channels.
- Find demographic and seasonal trends that you can use to create specific promotions.
- Discover potential opportunities
- Evaluate the effectiveness of your content marketing strategy
The importance of data for good reporting
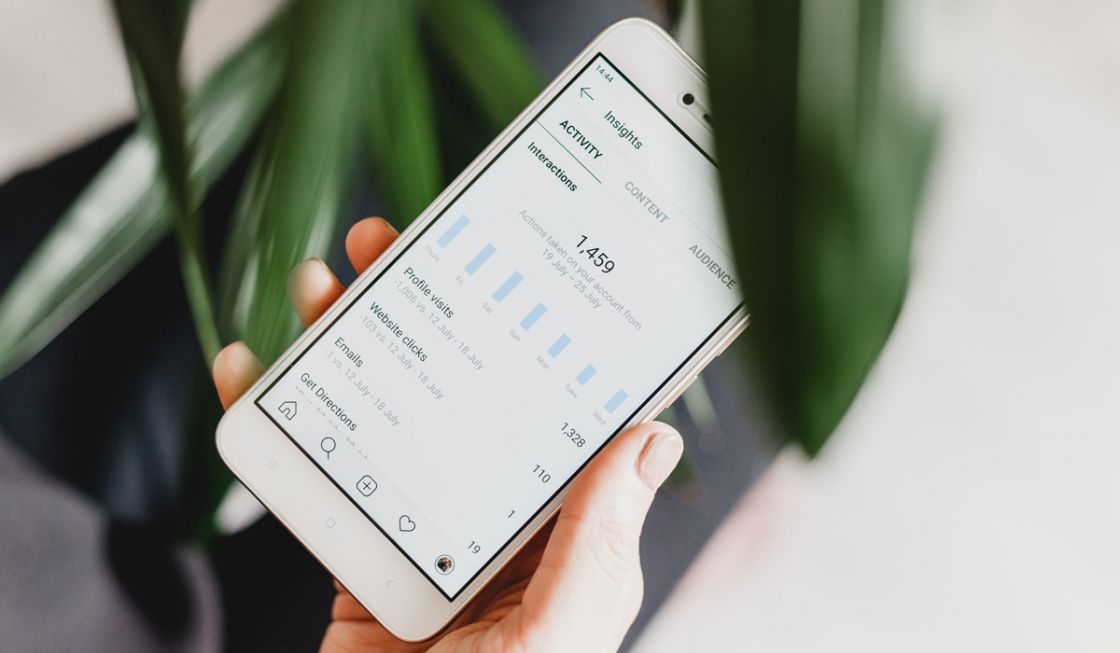
Advanced eCommerce reports are key to track your business’ success. These reports can measure the user’s entire purchase journey. Recommend offers you real-time statistics and a report section that allows you to follow your actions and measure results. For any online retail business, the reports not only provide snapshots of Marketing actions and business performance, but allow you to visualise user behaviour, understand their journey, and identify areas that require attention.
Recommend reports range from the performance of product recommendation panels to essential data from email and push notifications campaigns. Our most recent updates include:
Click map
This functionality is also known as “Heat Map“. It will help clients to know and understand which content is more attractive for their customers by showing the areas that receive more clicks. This will also allow marketers and content creators to define the best position for a banner, a call-to-action button, the best colour, copy, among other details.
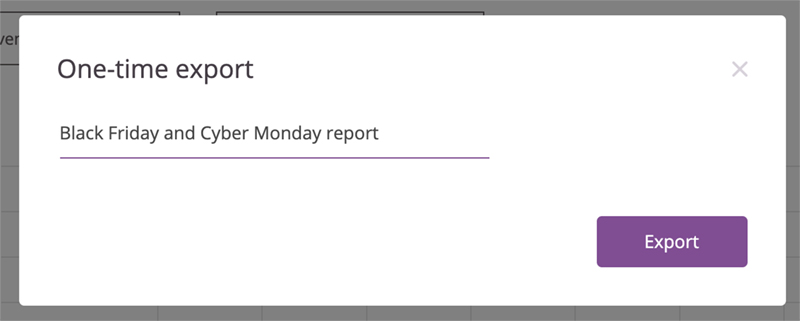
Export campaigns stats to CSV and Google Sheets
To improve usability and the creation of ad-hoc reports, Recommend has added the option to export the data as a CSV file or directly into a Google Sheet.

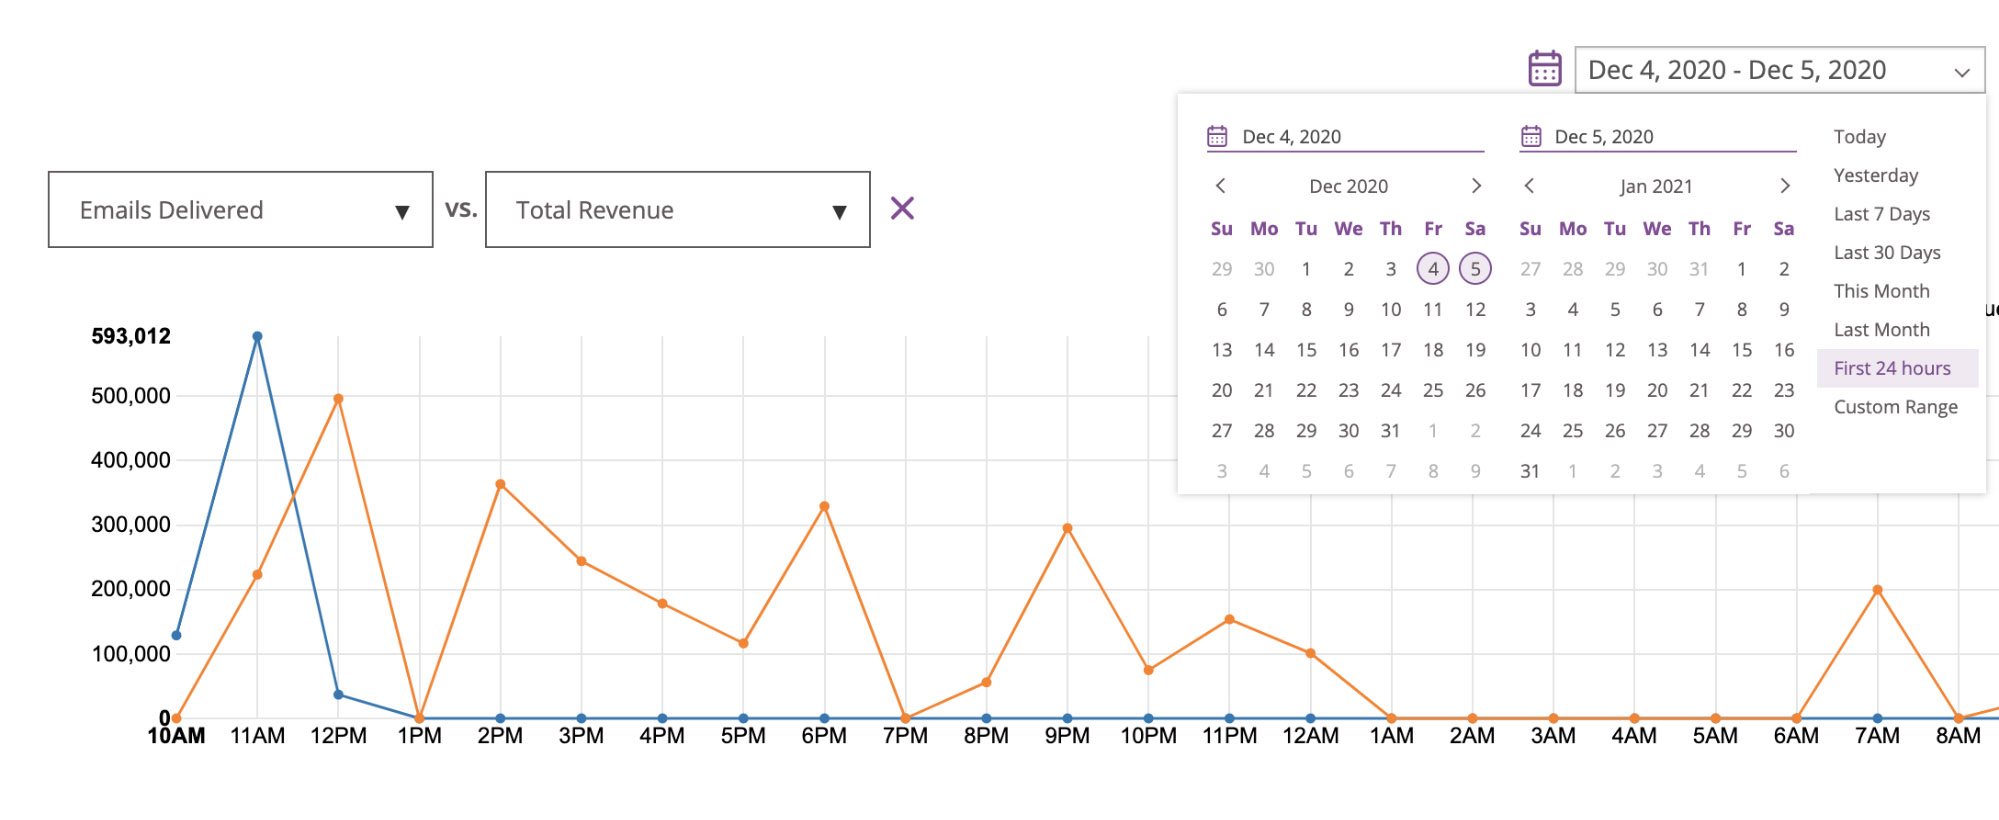
24-hour campaign performance diagram
A one-of-a-kind functionality. It allows your team to monitor the hour-by-hour performance of a campaign within the first 24 hours of the delivery of any campaign.

Compared stats for account’s current campaign, other campaigns, and other accounts
Comparative performance by open rate, click rate and unsubscribe rate of any current campaign vs another account’s campaigns. Also, it allows you to compare it across industry benchmarks. You can set up the report update at exactly the time you need. All new campaigns will be added to the report automatically.
Get ready for 2021
eCommerce will continue to grow during 2021. It is forecasted that around 2 billion people will purchase online next year. Having a strong online presence will become the cornerstone of any retail brand. This means that personalisation is key for your users’ shopping experience because the competition will be even more intense.
If you are looking for a solution that optimises your website, deliver true personalisation for your eCommerce and provides you with the main functionalities of digital marketing, look no further. Recommend is here to provide you with both personalisation and a 360º marketing experience. Contact us by clicking the button below.


